Final Project Part I: The Gig Economy Experience
The gig economy and service work have expanded significantly in the past few decades, rising to fill a gap in employment as more “classic” careers like manufacturing become untenable.
My one sentence summary of the narrative is currently: “Everyone loves gig economy workers until they start asking for labor rights.” I want to explore the average worker experience in the gig economy and help the reader understand (1) how robust labor rights protect us all and (2) how their individual actions can push us towards creating a more equitable labor force. I would like my target audience, who I am envisioning as everyday users of these services, to understand that gig economy work is not a panacea and that the convenience of the services they provide has a human cost.
With regards to structure, I am hoping to follow this narrative arc:
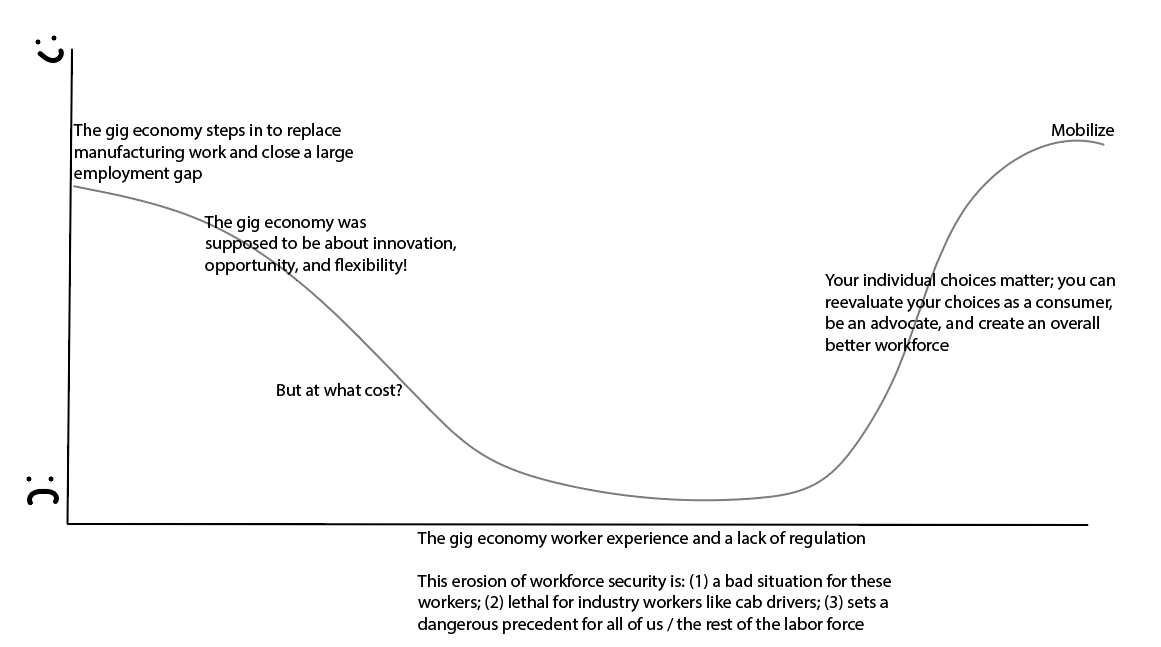
I want it to feel a bit like drawing the curtain back from an industry that markets itself exciting, convenient, and innovative – much like Dorothy revealing the true identity of the Wizard of Oz. I would like to begin by outlining the changes in the American job landscape over the past several decades, highlighting the decline of manufacturing and agriculture and the growth of the service economy we see today.
From there, I hope to emphasize the widening chasm between those who use these services and those who provide them – I want to highlight the average income, demographics, and challenges of gig economy workers. It will also be important to note that the way workers are treated in any industry can cause a troubling ripple effect that impacts us all – robust labor protections are good for all of us, not just those confined to a specific industry.
I am still refining my call to action – I want readers to feel energized and ready to mobilize, but I am ironing out the details of what I would like them to actually do. There are two approaches: (1) focusing on individual actions such as encouraging readers to avoid exploitative businesses or tip in cash, and (2) turning them into advocates for greater transparency and accountability, encouraging them to contact their representatives and protest harmful policies. Ideally, the narrative could combine both calls to action, but I may need to spend more time with the data first to see which approach may be more impactful with the information available.
Where are the data coming from?
The Gig Economy Data Hub, which tracks which organizations are collecting what data on gig economy work. While they themselves do not provide the raw data, they do provide ample citations that can be traced back to their sources – which, at this time, primarily seem to be the Bureau of Labor Statistics (BLS) and Federal Reserve Economic Data (FRED). The challenge of this project is that gig economy workers are classified as “independent contractors,” so it is difficult to ensure that the data we are looking at is specifically about these workers without extra noise from other independent contractors. The data I will need primarily stems from BLS and Census Bureau surveys that explicitly target gig economy workers, although broader data about labor trends from BLS and FRED will help supplement those data.
In addition, other organizations, both non-profit and those in private industry, have produced useful reports for this analysis. These include, but are not limited to, the Aspen Institute’s Future of Work Initiative, Prudential’s ”Gig Workers in America” report, and JPMorgan Chase’s ”Online Platform Economy” report. The data promotes a counter narrative that, in spite of the narrative that gig economy work provides flexibility and supplemental income, the majority of workers rely on them for their full-time salaries, much to their detriment.
As mentioned previously, I want to use this information to highlight the individual experience of an average gig economy employee, potentially in contrast to someone who works a more “white collar” job at a similar company. In addition, I would also like to highlight how quickly expenses can pile up for these workers (who often need to may for their own car loans, gas, tolls and fees, and so on), and how classifying them as independent contractors prevents them from receiving benefits offered to other full-time employees, such as health insurance.
Sketch Brainstorm
The narrative will be broken down into several components:
1. The Rise of the Gig Economy
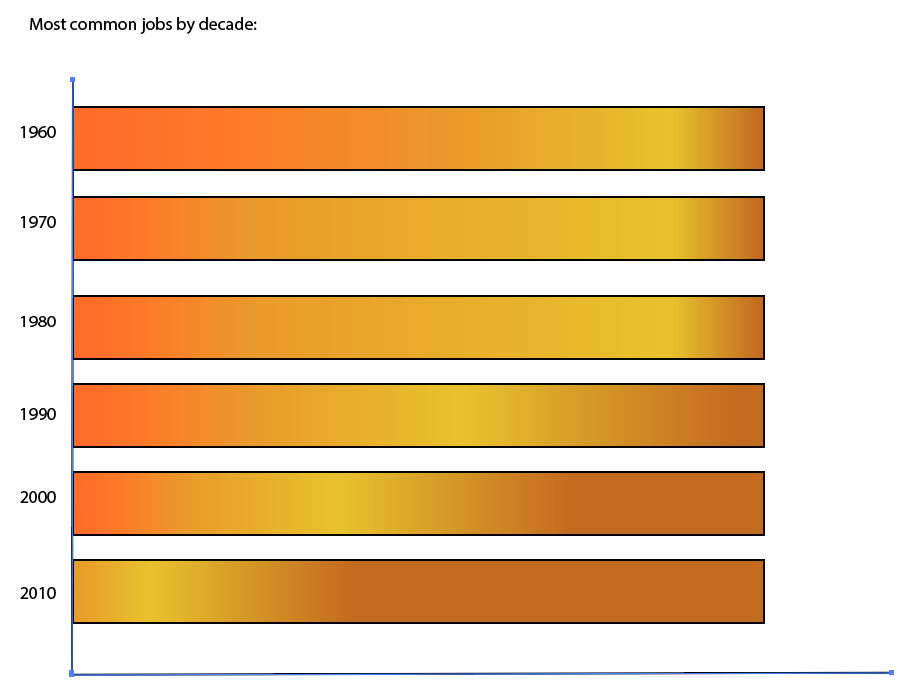
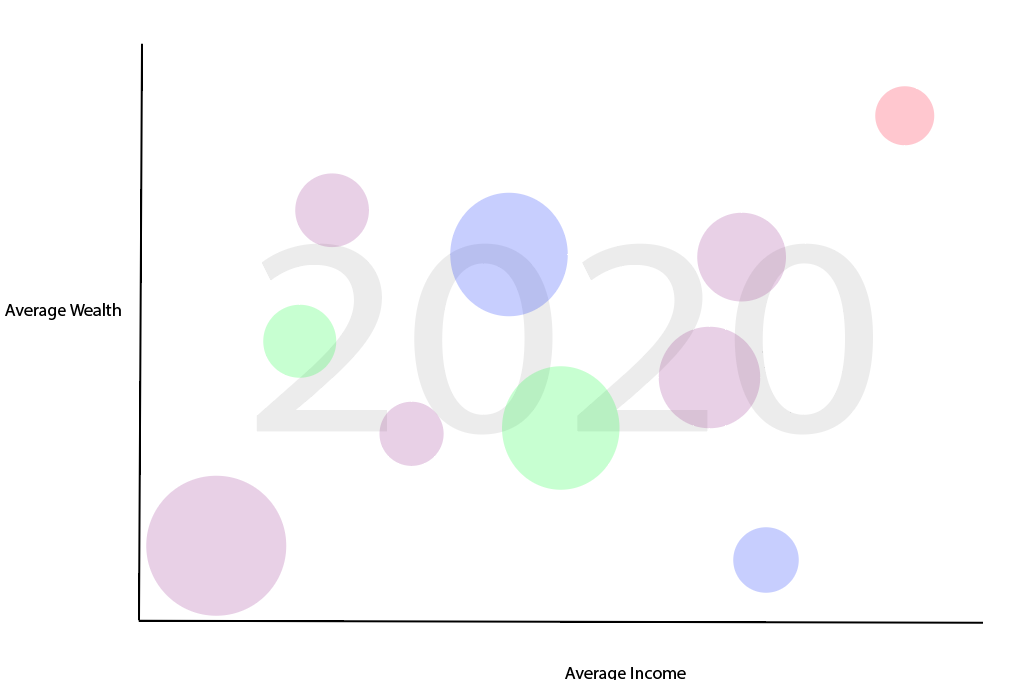 In this introduction, I want to convey how quickly the gig economy has grown, and the context that allowed it to flourish. A decline in multiple American industries, coupled with the recession of the late 2000s, created an economic situation ripe for this type of employment. I’m not sure how to best convey these changes – my two preliminary sketches are a bar graph highlighting the most prominent (or perhaps fastest-growing) industries over time and a Hans Rosling graph comparing income and wealth of workers by industry over time, assuming I am prepared to shift through that volume of data.
2. The Gig Economy Worker
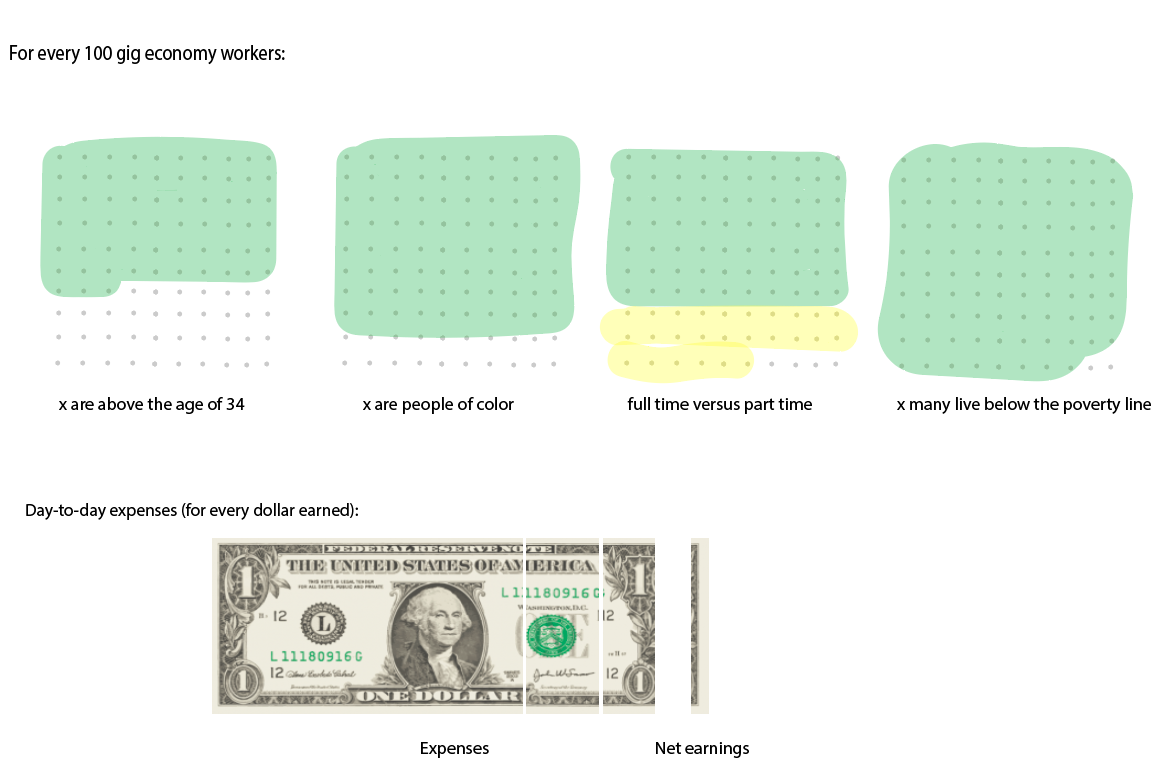
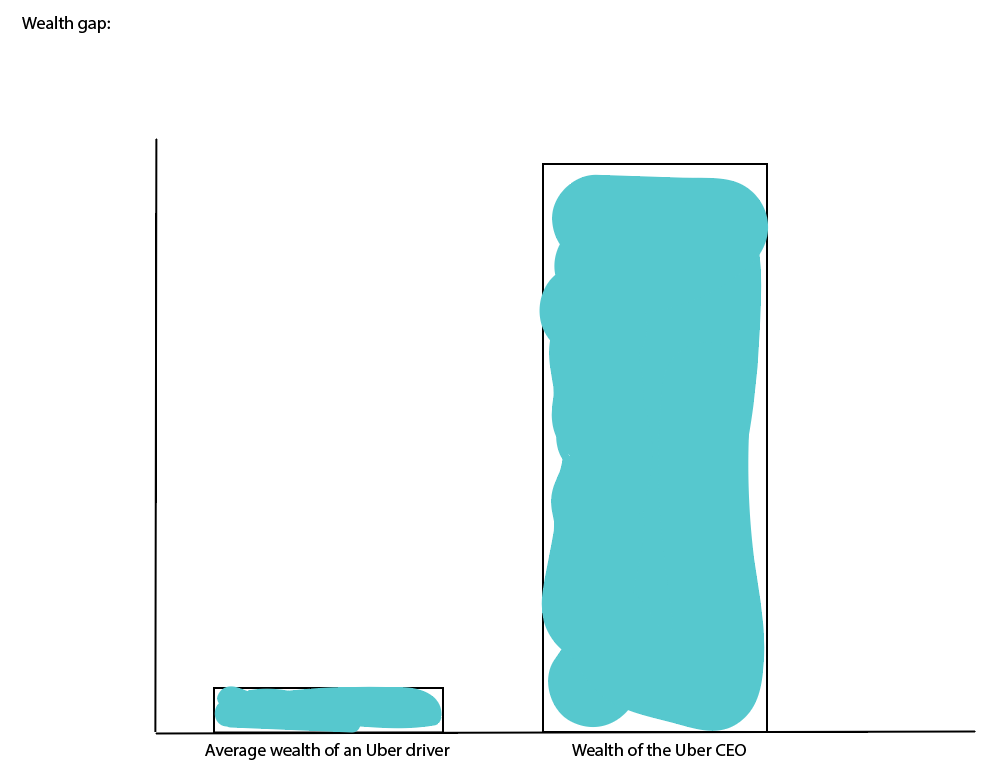
When outlining the experience of the average gig economy worker, there are a few ideas I’m considering. It’s important for me to outline the demographics so we all have a shared understanding of who we are talking about, but I’m not sure which aspects of their work I want to highlight. One thing I’m considering is using the “dollar” imagery to help visualize how much money per dollar made is actually invested back into working a gig economy job, versus an employee’s take home pay. I also want to highlight how these jobs exacerbate the wealth gap, comparing the average worker’s wealth to that of their CEO and, perhaps, that of the average American overall. I may try to include additional visuals regarding worker safety – I want to spend some time doing qualitative research to see what the workers themselves feel are the most challenging aspects of their job.
3. Your Impact
I have not yet sketched out the graphics for the readers’ potential impact, as I have not settled on an approach to it just yet. Some useful feedback I have gotten in class has been that individuals would like to see the cost of improving policies on them as the consumer, and would appreciate reassurance that it would not create services out of their own price range.
If the data are available, I would also like to display the differences between those who supported policies like California’s Proposition 22 (primarily the companies themselves, who poured immense amounts of funding into passing this initiative) and those in opposition to it (predominantly workers). It would be interesting to see the disparity in funding on both sides of this particular proposition. I am, however, open to suggestions for the call to action.
Method and Medium
I will be using Shorthand to prepare the final project – it feels like the most intuitive tool that we’ve seen thus far, and taking the time to learn how to use it would be more efficient use of my time than scoping out other potential platforms.
In terms of an action plan, I will spend this week delving into qualitative research and getting a more thorough understanding of gig economy workers and how they would like others to get involved. I will also begin outlining the arguments from the aforementioned reports and linking them to the BLS and FRED data; I hope to have a comprehensive outline by the end of the week, highlighting key talking points, statistics, and selecting the raw data that feels the most impactful for our analysis.
With that outline, I will begin adding components to Shorthand to see (1) how I would like to structure my narrative flow and (2) identifying the types of visuals that would be most effective on that platform.